There are no items in your cart
Add More
Add More
| Item Details | Price | ||
|---|---|---|---|

View Time | Validity
Duration
Certified Course
Experienced Instructor
Create clear and engaging financial reports and dashboards for effective data communication.
Analyze live data for quick and informed decision-making in financial planning and strategy.
Turn data into compelling narratives, enhancing your ability to communicate financial insights.
Facilitate team collaboration with seamless sharing and collaborative financial reporting.
Gain a competitive edge with advanced analytics, uncovering deeper financial patterns and trends.
Boost productivity through automation, saving time for strategic initiatives in financial reporting.
"Welcome to the Google Data Studio for Finance: Transforming Financial Insights course! As your dedicated guide and instructor, I bring a wealth of experience in the finance industry coupled with a profound understanding of data visualization.
My goal is to empower finance professionals like you to excel in harnessing the power of Google Data Studio for impactful analysis. Throughout this course, I am committed to providing you with practical knowledge, real-world examples, and the guidance necessary to master Google Data Studio and enhance your data visualization skills within the finance domain.
Let's embark on this exciting learning journey together, unlocking the full potential of Google Data Studio to transform the way you visualize and analyze financial data!"
Overview of the course, materials, and the significance of Google Data Studio in enhancing data visualization skills.
Understanding Data Studio's interface, differentiating between datasets and data sources, and practical aspects like opening Data Studio and adding/managing data sources
Utilizing data tables, customer tables, styling options, and scorecards to emphasize numerical information.
Mastering bar charts and stacked charts, including simple bar and column charts along with their variations.
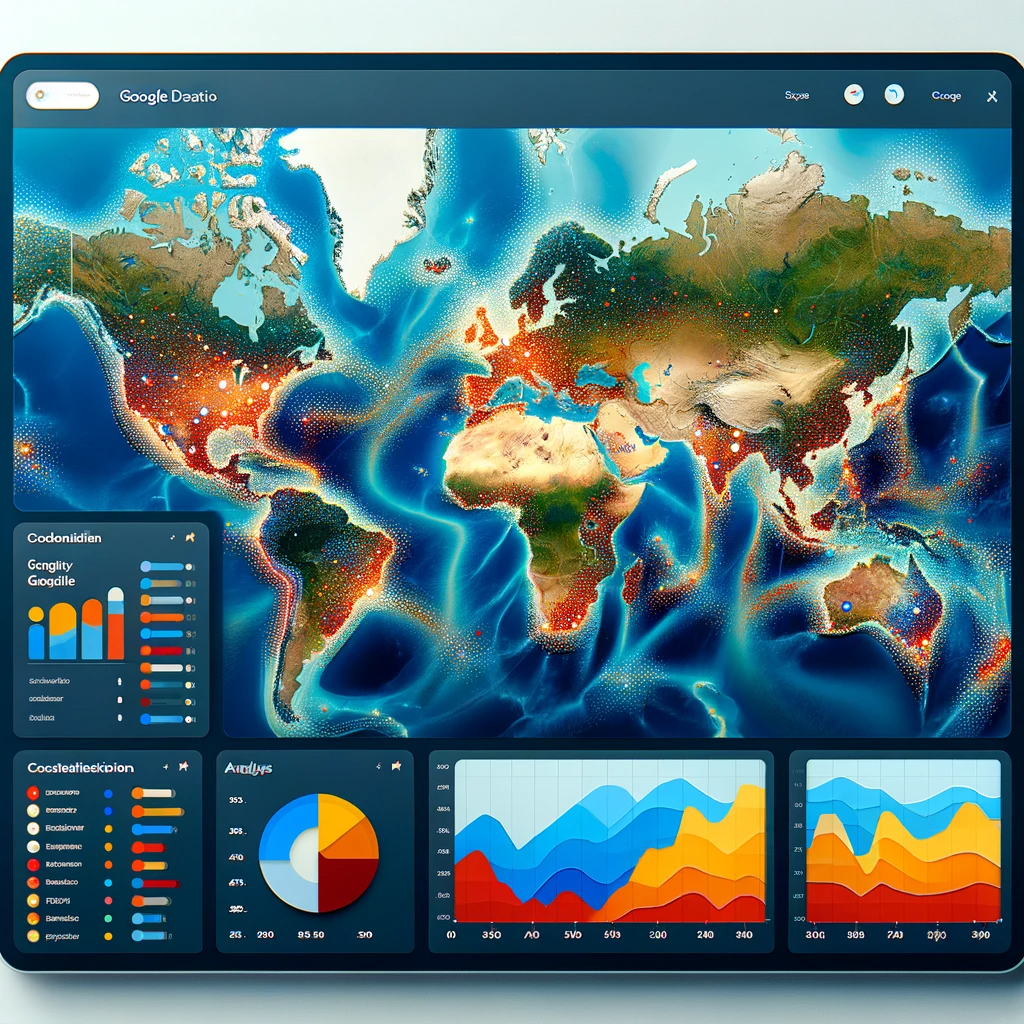
Visualizing geographical data using GeoMaps to represent information on a country, continent, or region level.
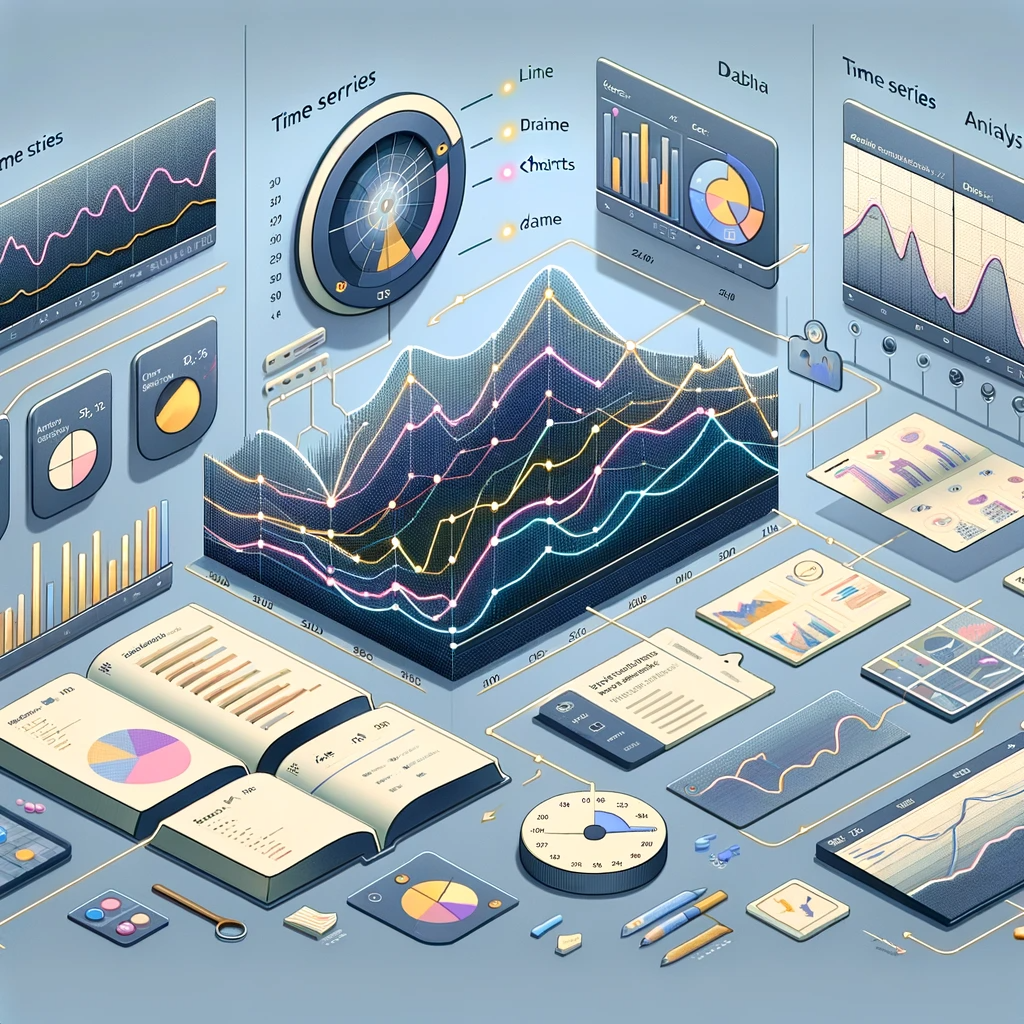
Exploring time series, line charts, area charts, and their combinations for effective trend analysis.
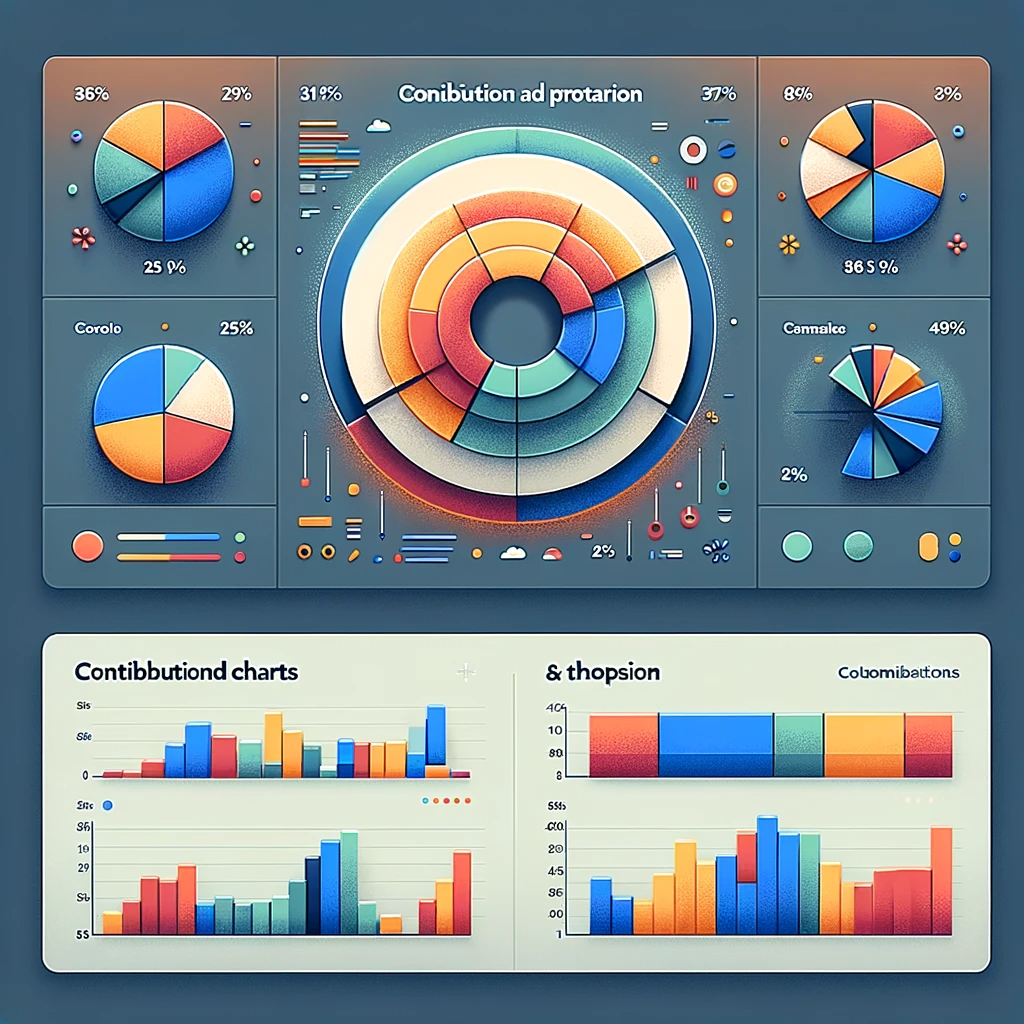
Understanding and implementing pie charts, donut charts, and stacked area charts to highlight contributions.
Utilizing scatter plots and bubble charts to explore relationships between variables in your data.
Leveraging pivot tables for cross-tabulation and gaining insights by aggregating data on two dimensions.
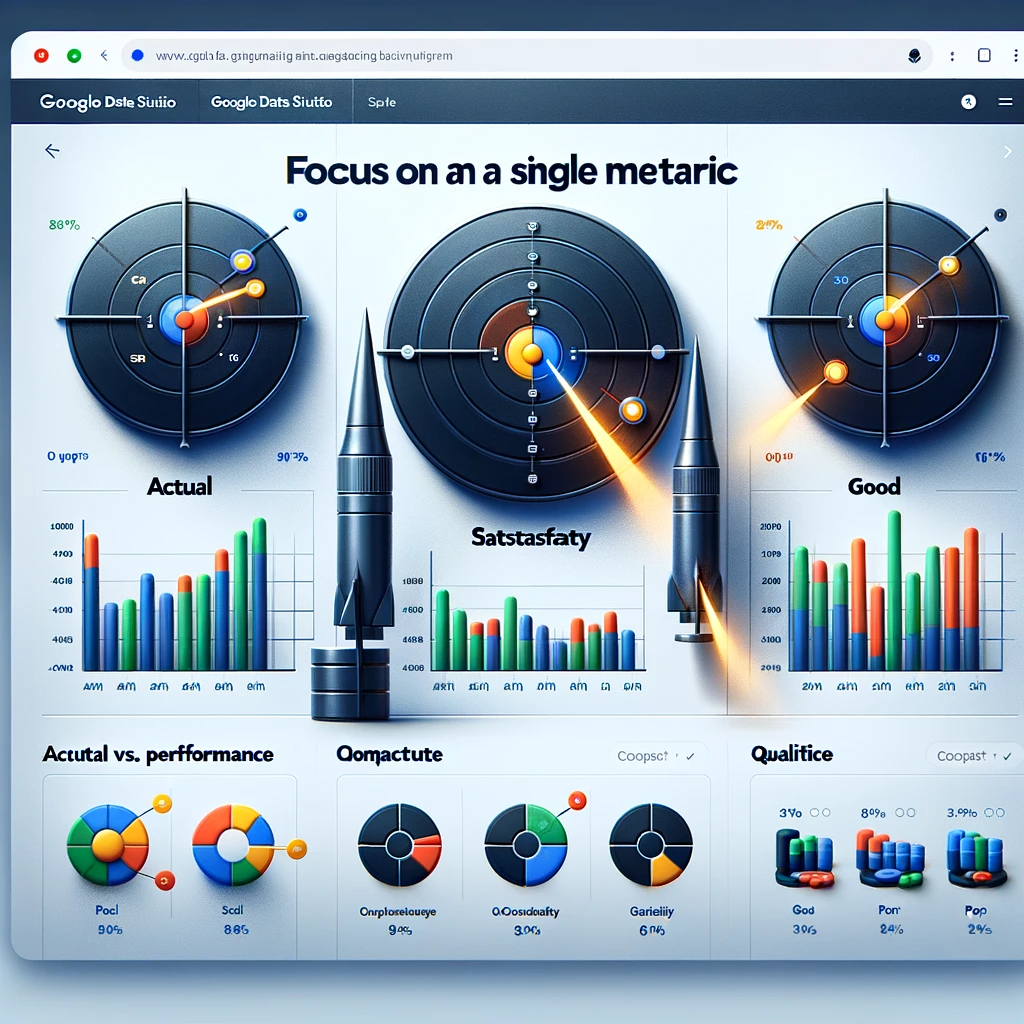
Using bullet charts to focus on a single metric and visualize its performance effectively.
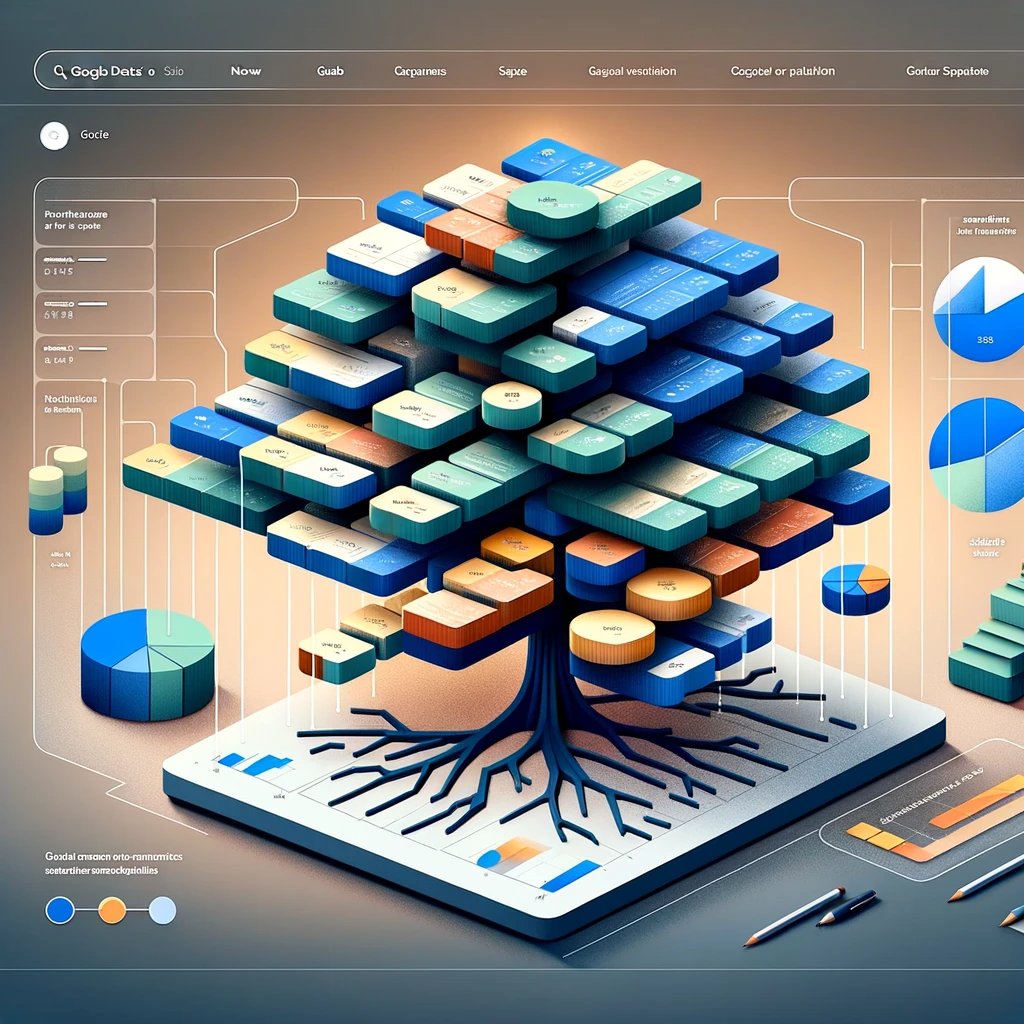
Exploring TreeMap charts to represent hierarchical data structures.
Creating a branded report by incorporating logos, company details, and choosing appropriate brand colors. Also, enabling viewers to personalize data views through filter controls.
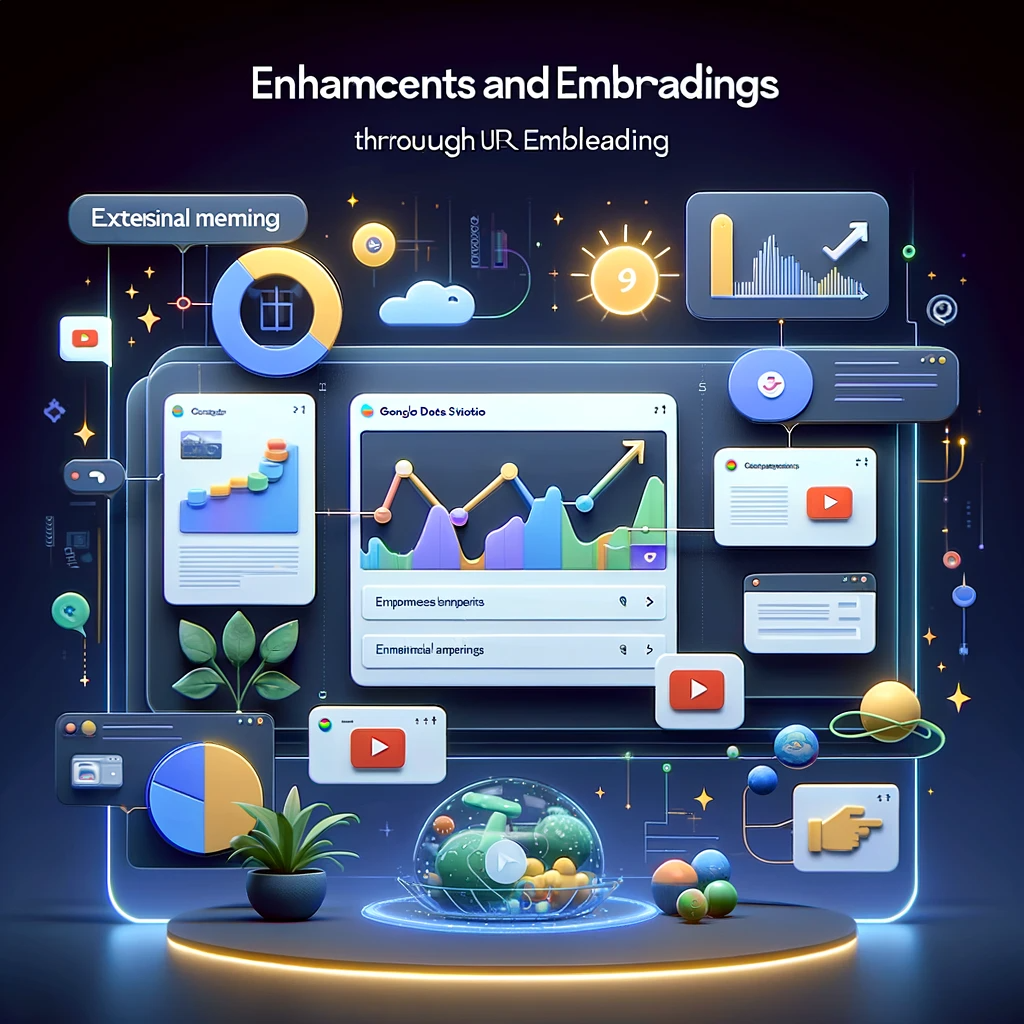
Enhancing reports by embedding external content like videos and feedback forms through URL embedding. Addressing scenarios where data resides in multiple tables and learning how to blend them effectively.
Understanding various sharing options, including downloading reports, sharing through links, scheduling emails, and embedding on websites.
Connecting and visualizing data in Google BigQuery for advanced analytics and reporting.
Guidelines for effective charting, emphasizing messages, eliminating distractions, and avoiding clutter in visualizations.
If you have any doubts or queries, feel free to reach out to us by shooting us an email at support@camonk.com or by calling us at +91-9022720882.
Contact UsGoogle Data Studio is a fantastic tool for anyone who wants to get started in BI or who simply wants to go beyond excel and produce automated interactive reports. The interface is very easy to navigate around and the workflow is kept as simple as possible.
With Data Studio, you can easily report on data from a wide variety of sources, without programing. In just a few moments, you can connect to data sets such as: Databases, including BigQuery, MySQL, and PostgreSQL. Google Marketing Platform products, including Google Ads, Analytics, Display & Video 360, Search Ads 360.
Most people would give it a 7 to 9 on a scale of 1 to 10, with 10 being the most difficult. However, after completing this course, all of our students find Data Studio to be less complicated.
Learning Google Data Studio has lot of advantages, such as
1. Pull data from multiple sources
2. Create easy-to-read reports for everyone
3. Get dynamic reporting
4. Share Data Studio reports easily
5. Use free Data Studio templates
The answer to that is YES! Google Data Studio is a FREE tool that is available for anyone to use.
 No Prior Experience Required


